728x90
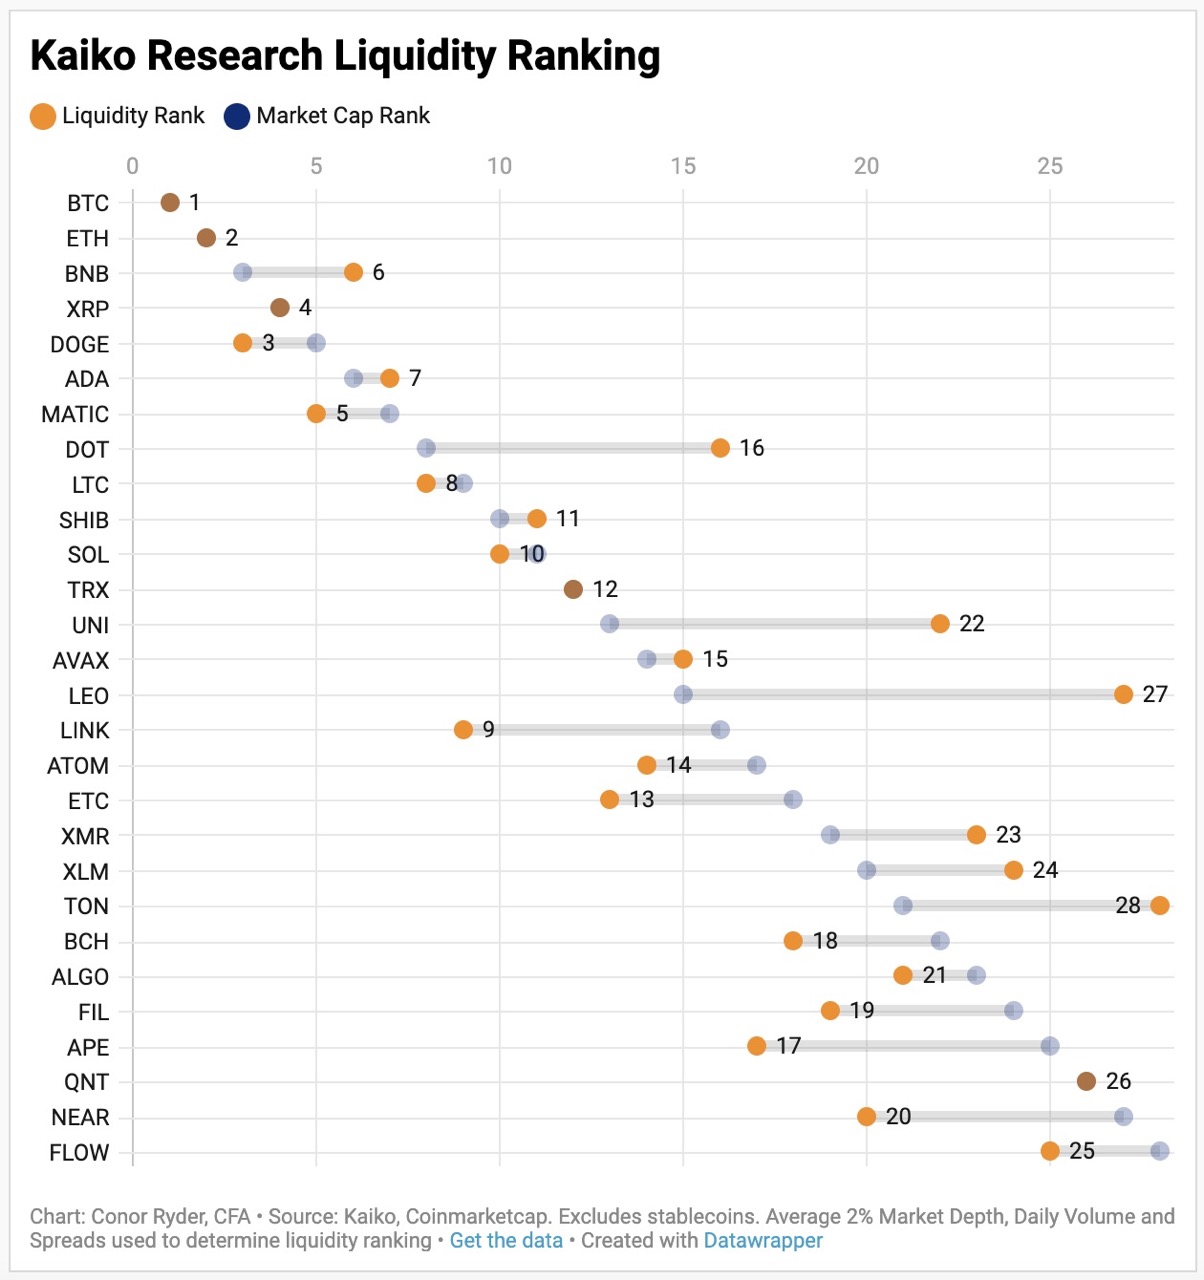
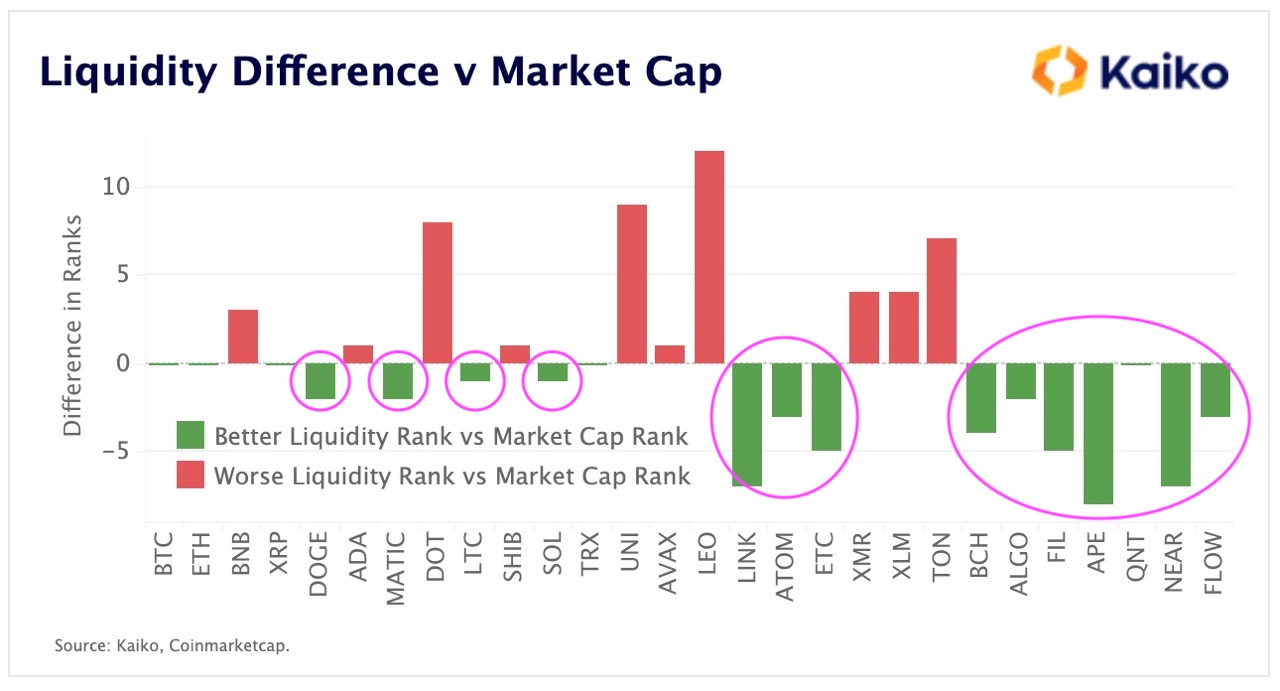
Discrepancies between Market cap & Liquidity rank
<Source: Conor Ryder, CFA - Kaiko Research>
시가총액과 유동성 순위의 차이
Not a financial advice / Reference use only
Is there a discrepancy between
market capitalization & liquidy rank?
Bottom line:
시가총액 Market Cap + 유동성 Liquidity 종합 순위
1. 비트코인 BTC
2. 이더 ETH
- 시가총액만으로 토큰의 가치를 제대로 평가하기는 역부족
- 개별 토큰들의 유동성 문제를 파악함으로써 시가총액에 대한 재평가
- 시가총액, 유동성 각 순위의 차이를 확인함으로써 해당 토큰 가치의 신뢰성 재검증
- Generally considered as Market cap = Value of a cryptocrrency
- Not all market caps are created equal.
- If Market cap = Value of a cryptocrrency must be true, the sub-condition is if an asset is liquid or not.
- FTT: Top 20 token pre-collapse = Liquidity Crunch
- LUNA: Top 10 pre-collapse = Liquidity Crunch
Thus, market cap = misleading metric when investors equate it to the liquidity of a token.
3 metrics to assess a total liqudity of each token:
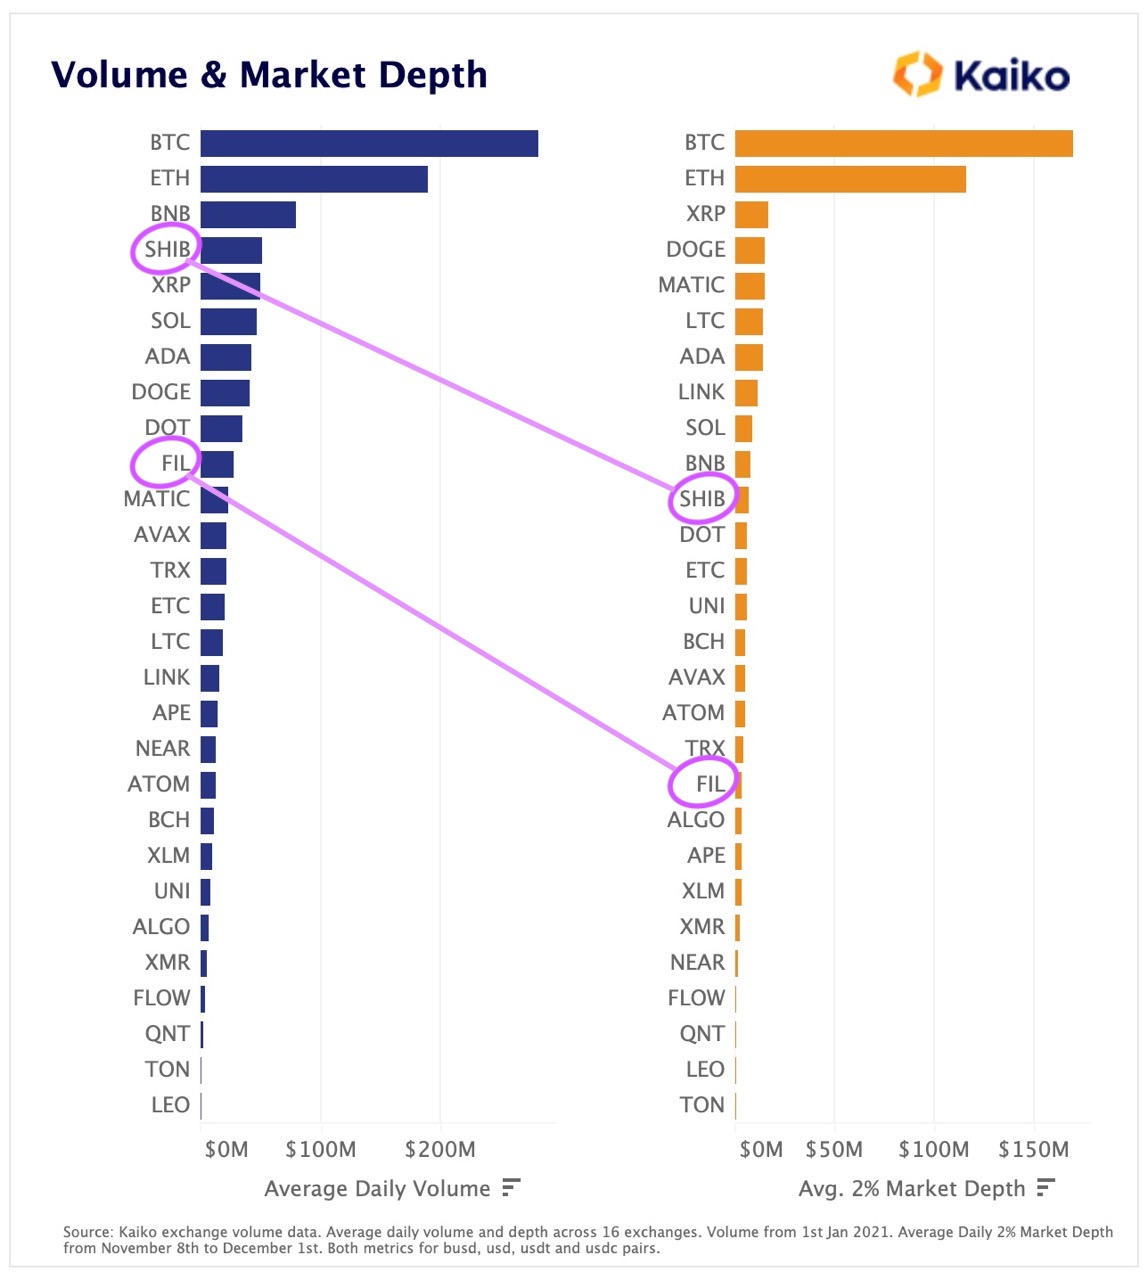
- Volume
- Market depth
- Spreads
A New Model for Assessing Crypto Asset Liquidity
The Data
- Ranked by market capitalization, excluding stablecoins & wrapped tokens.
- For volume and market depth, data was aggregated across all active USD, BUSD, USDT, and USDC-denominated pairs on 16 of the most liquid centralized exchanges. (This encompasses a majority of market activity.)
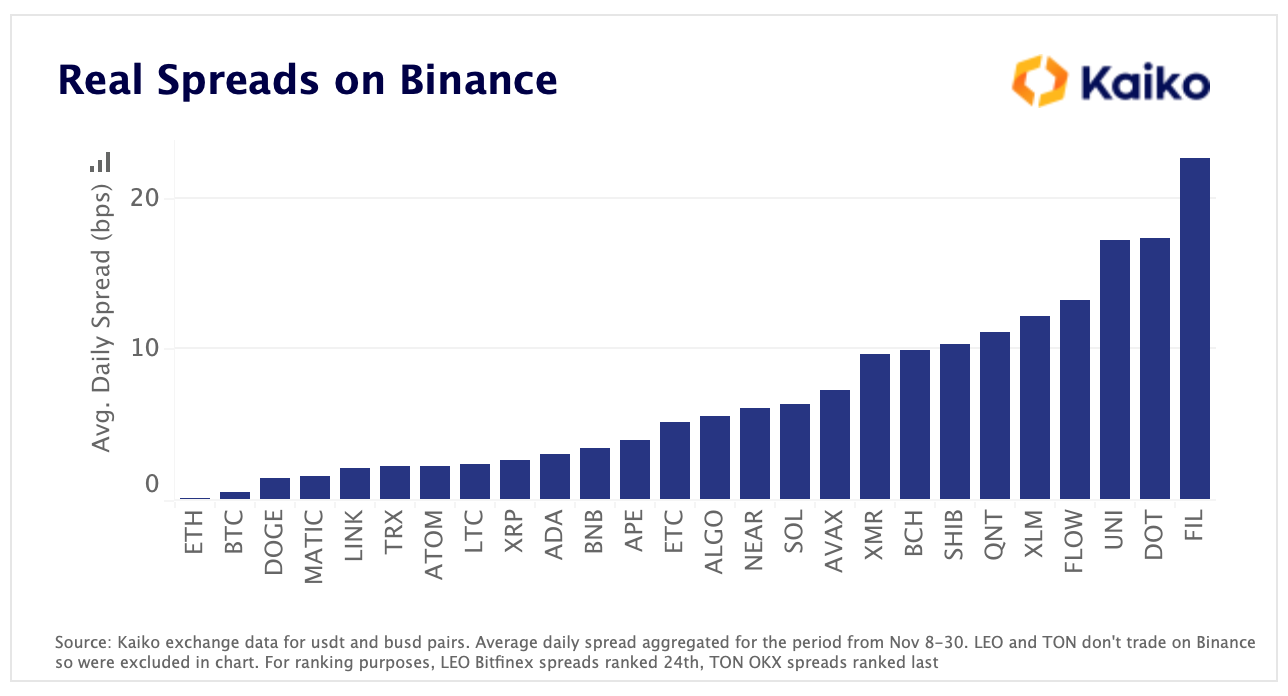
- For spreads, only data from Binance is used, which is the most liquid exchange across the widest range of markets.
- 3 major metrics: Volume, Market depth, and Spreads
1. Volume
- Daily trade volumes, specifically on centralized exchanges.
- Strongly correlated to order book liquidity measures such as market depth and spread.
- Tokens that have higher trade volumes typically have deeper order books, which enables traders to trade an asset with limited impact on price.
- But, in crypto markets there can be discrepancies in this correlation in case of makret manipulating actions such as wash trading, which means that trade volume alone is not adequate to fully assess liquidity.
2. Market Depth
- Calculated from the number of buy and sell orders at various price levels on each side of the mid price. (In this analysis, 2% market depth is taken)
- If market depth is “deep” for a given token, this means that there is sufficient volume of open orders on either the bid or ask side, which ultimately makes it easier to exchange the asset at prices reflecting its intrinsic value.
- The weaker a market’s depth, the easier it is for larger market orders to move the price.
3. Spreads
- Calculated by taking the difference between the best bid & the best ask on an asset’s order book at a moment
- The smaller the spread the more liquid the market
- Wider spreads = Wekaer liquidity for an asset, meaning more difficult to exchange the asset at stable prices
- Important metric when assessing the overall liquidity of an asset from an investment standpoint
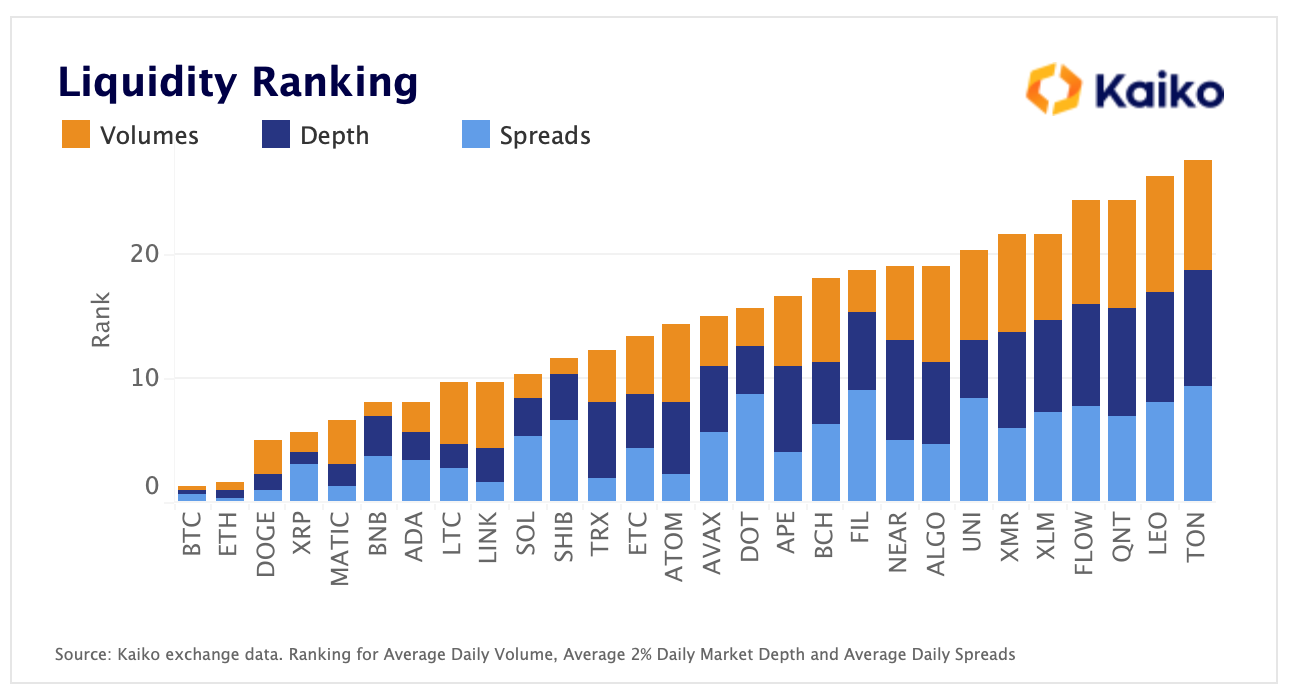
Total Liquidity Ranking
- Volume & Depth: The highest ranking token will have the highest quantity for each measure.
- Spread: The highest ranking token will have the lowest measure (narrow spreads = more liquid).
'2. 암호화폐에 관한 모든 것 > 시장분석' 카테고리의 다른 글
| [시장분석] 암호화폐 시장친화적으로 변화 중인 홍콩과 그것이 시장에 미칠 영향 (15) | 2023.02.24 |
|---|---|
| 10 Defining Market Events of 2022 by Kaiko Research (1) | 2022.12.27 |
| Crypto Use Cases in Developing Economies (0) | 2022.12.23 |


댓글